The following are visual graphics to aid our understanding of managing the Colorado River Basin.
_____________________________________________________
_____________________________________________________
Recent Climate Science
Past Climate (Cenozoic Era)
_____________________________________________________
ON THE COLORADO
Transbasin Diversions
Consumptive Uses
Leakage below Glen Canyon Dam
Streamflow
Flooding
Hydropower
Sediment
Evaporation
Glen Canyon Dam Operations
Lake Powell Elevations
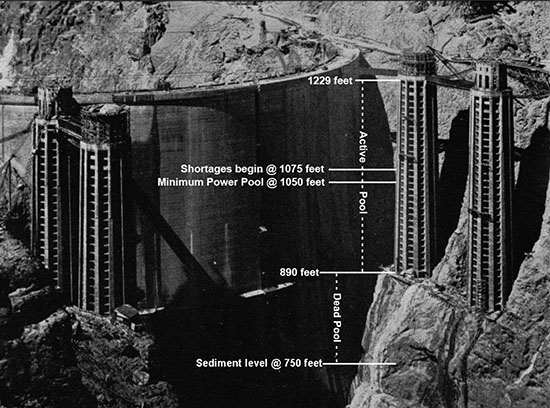
Hoover Dam Operations
Lake Mead Elevations
Colorado River Augmentation
Hydropower
Other
Photos
_____________________________________________________
ARIZONA DEPARTMENT OF WATER RESOURCES OR CAP
_____________________________________________________
BUREAU OF RECLAMATION
Temperature and Precipitation
Water Yield of Colorado River
Flood Control
Green River and Yampa River
Lake Powell or Glen Canyon Dam
Lake Mead or Hoover Dam
Lakes Powell and Mead
Basin State Allocations & Consumption
Basin Supply & Demand Study
Lower Basin
Project Inventory
Western Region Projects and Power Transmission Lines
_____________________________________________________
CALIFORNIA'S COLORADO RIVER BOARD
METROPOLITAN WATER DISTRICT of Southern California
_____________________________________________________
COLORADO DEPARTMENT OF NATURAL RESOURCES (archive)
_____________________________________________________
DROUGHT & PERSISTENT DRYING
_____________________________________________________
ENSO
_____________________________________________________
MAPS
_____________________________________________________
NATURAL RESOURCES CONSERVATION SERVICES
_____________________________________________________
SOUTHERN NEVADA WATER AUTHORITY
_____________________________________________________
US GEOLOGICAL SURVEY
_____________________________________________________
OTHER
Dams
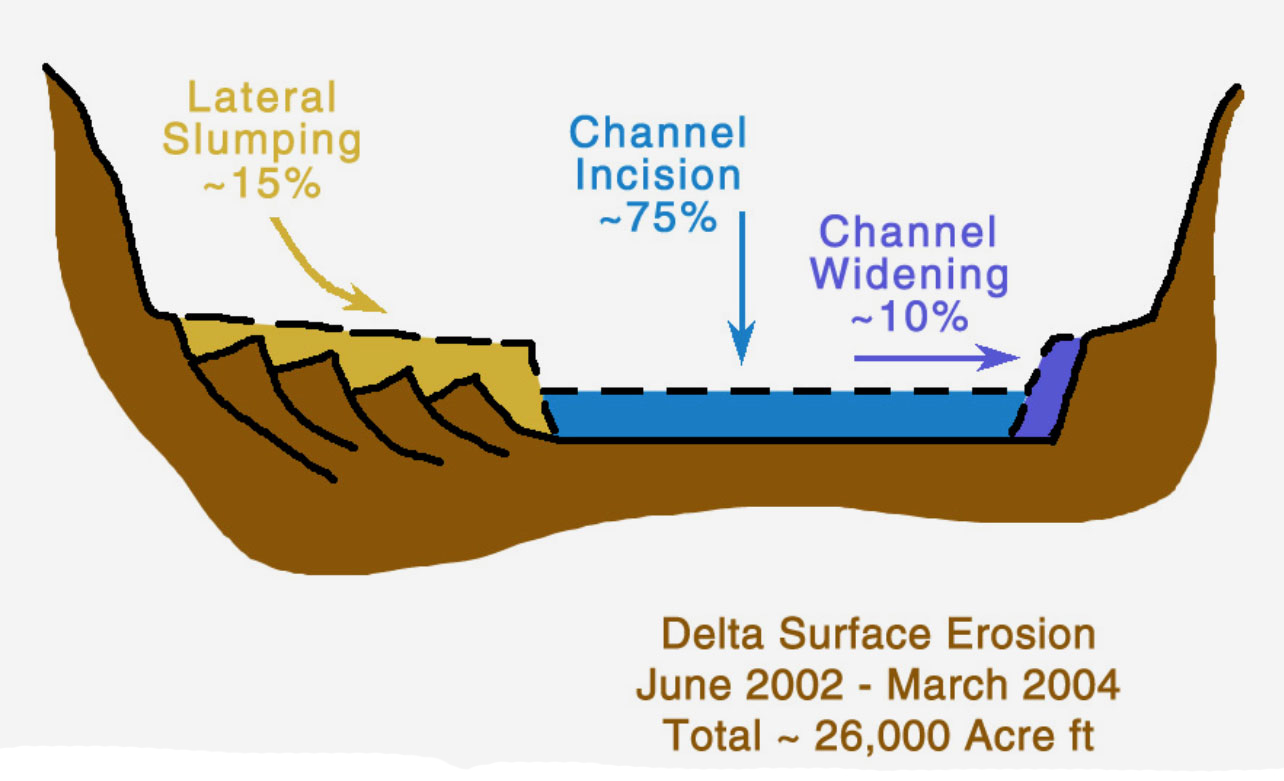
Delta
Drought
Storage
Flow
Consumptive use
Energy
Run-off
Temperature
Sediment
Uranium

